
Emission Performance Score
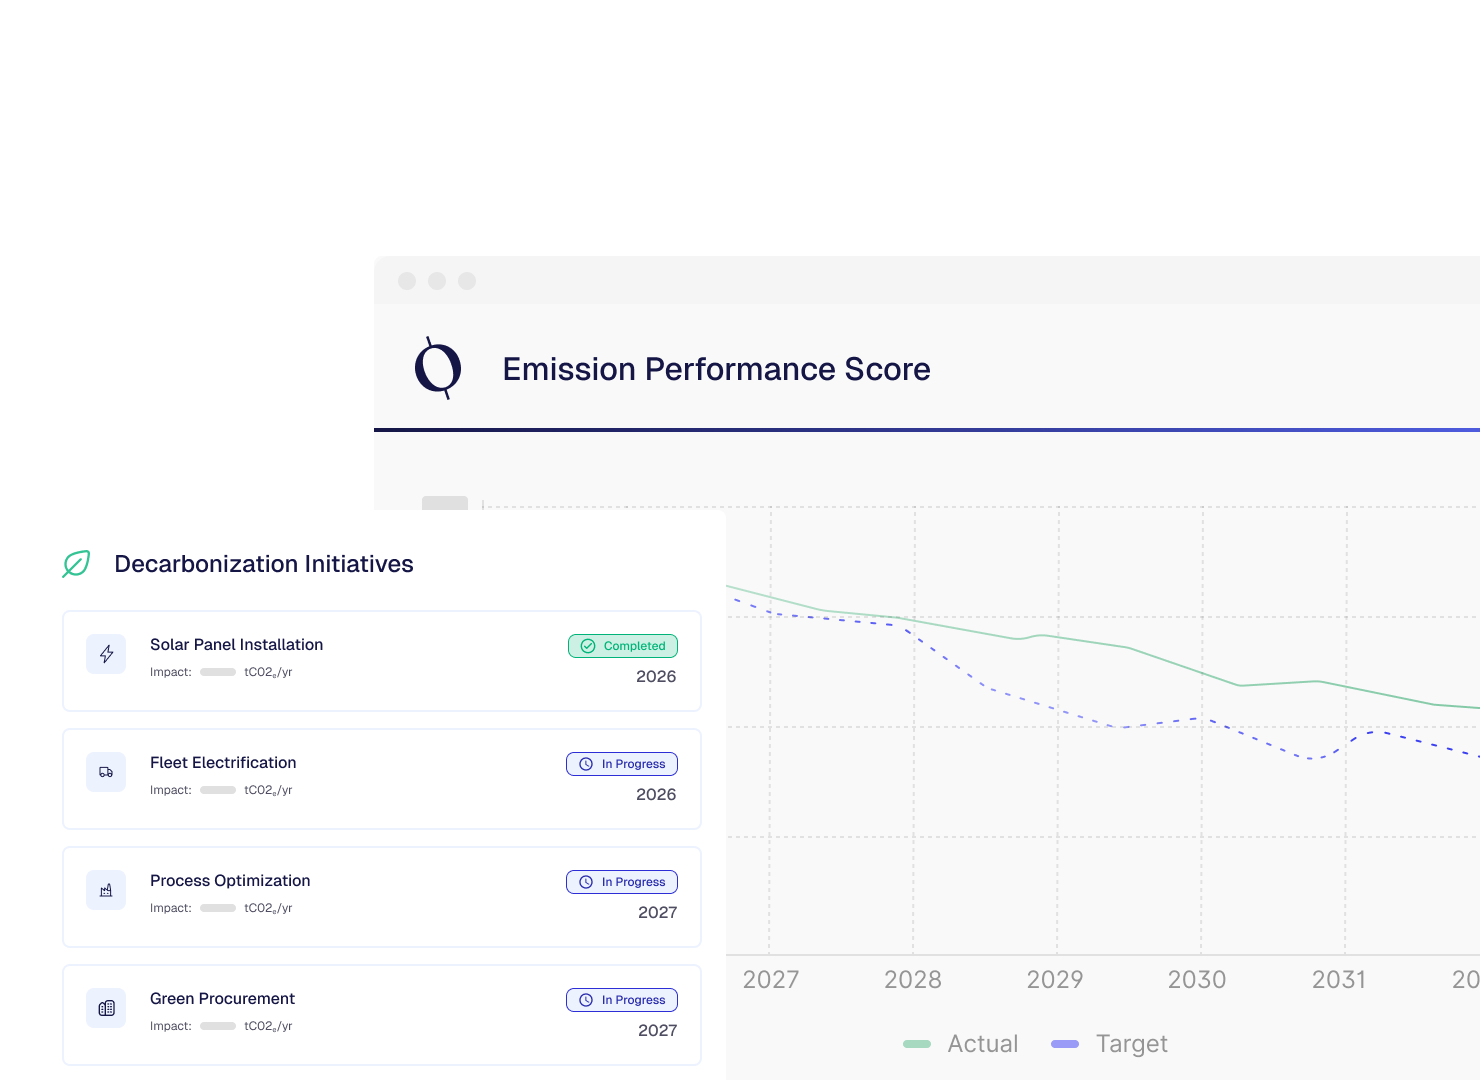

Emission Performance Score is the core Cindeks™ score that shows your company’s carbon emissions level and the strength of its reduction strategy.
Using CCAS™ data, it analyzes your Scope 1–2–3 coverage rate, the presence of product carbon footprint studies under ISO 14067, and your emissions intensity against sector averages. It also summarizes your CBAM technical alignment status and your net-zero / emissions reduction targets under a single score.



Emissions data is imported
Corporate and product-level emissions data from CCAS™, including Scope 1–2–3 breakdowns, is transferred into the system.

Coverage rate is analyzed
The system calculates which facilities and activities contain Scope 1–2–3 data, where gaps exist, and derives an overall coverage rate.

Emissions intensity and benchmarking are performed
Emissions are normalized against indicators such as revenue, production volume, and energy use, and the results are compared with sector averages.

Product footprint, CBAM, and targets are checked
Product carbon footprint studies under ISO 14067, CBAM technical forms, and net-zero / reduction target statements are assessed.

Score and summary view are generated
All of these indicators are converted into the Emission Performance Score, and a summary table highlights both strengths and areas requiring improvement.
Goes beyond total emissions by summarizing coverage, intensity, and target information in a single score.
Shows where data is strong and where it is missing through a clear coverage-rate view.
Positions your performance by comparing your emissions intensity with similar companies.
Shows numerically what kind of emissions performance stands behind your target statements.
Adds a strong reference based on actual emissions performance alongside compliance and disclosure scores.
Which components make up the Emission Performance Score?
It evaluates not only total emissions, but also Scope 1–2–3 coverage, emissions intensity, product footprint studies, CBAM alignment, and net-zero / reduction targets together.
Which data is used?
It uses corporate and product-level emissions data from CCAS™, operational indicators such as production and revenue, ISO 14067 product footprint outputs, CBAM technical forms, and net-zero / reduction target statements.
Is it a meaningful score for SMEs as well?
Yes. Even with fewer facilities and activities, a score can still be produced based on existing Scope 1–2–3 data, basic intensity indicators, and simple target statements, while missing areas are flagged as development points.
How often should this score be updated?
It is recommended to update it at least once a year when a new emissions inventory is produced. If emissions data is updated more frequently, such as quarterly, the score can be refreshed at the same cadence.
What does this score provide for net-zero and CBAM processes?
It shows numerically your starting point on the net-zero roadmap, your progress, and your technical preparedness for CBAM, and creates a reference point for your emissions performance in discussions with banks, investors, and auditors.


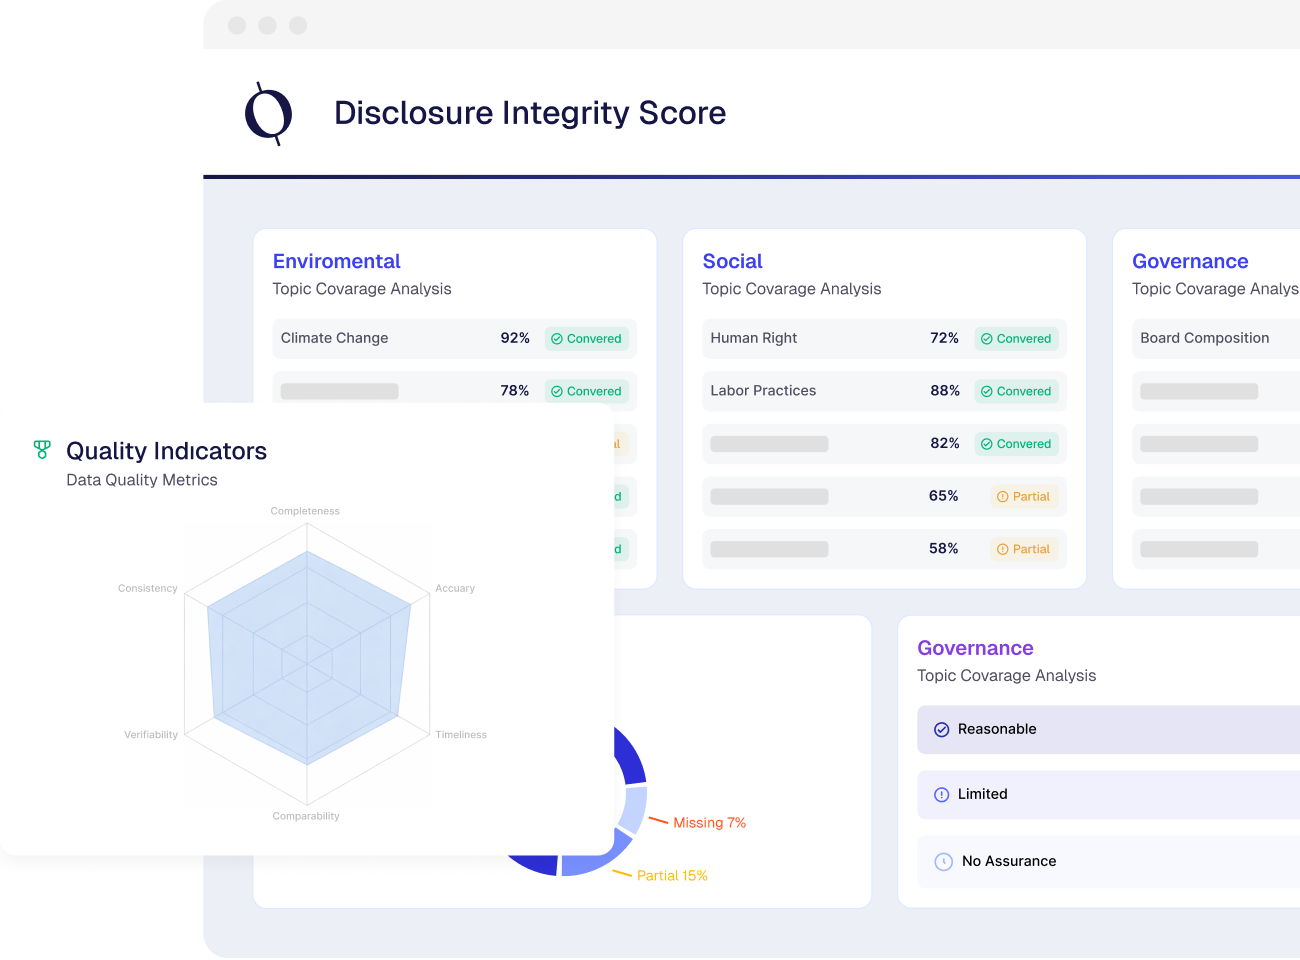
Disclosure Integrity Score
Disclosure Integrity Score is the core Cindeks™ score that measures the quality of your company’s ESG disclosures and its level of alignment with relevant standards.

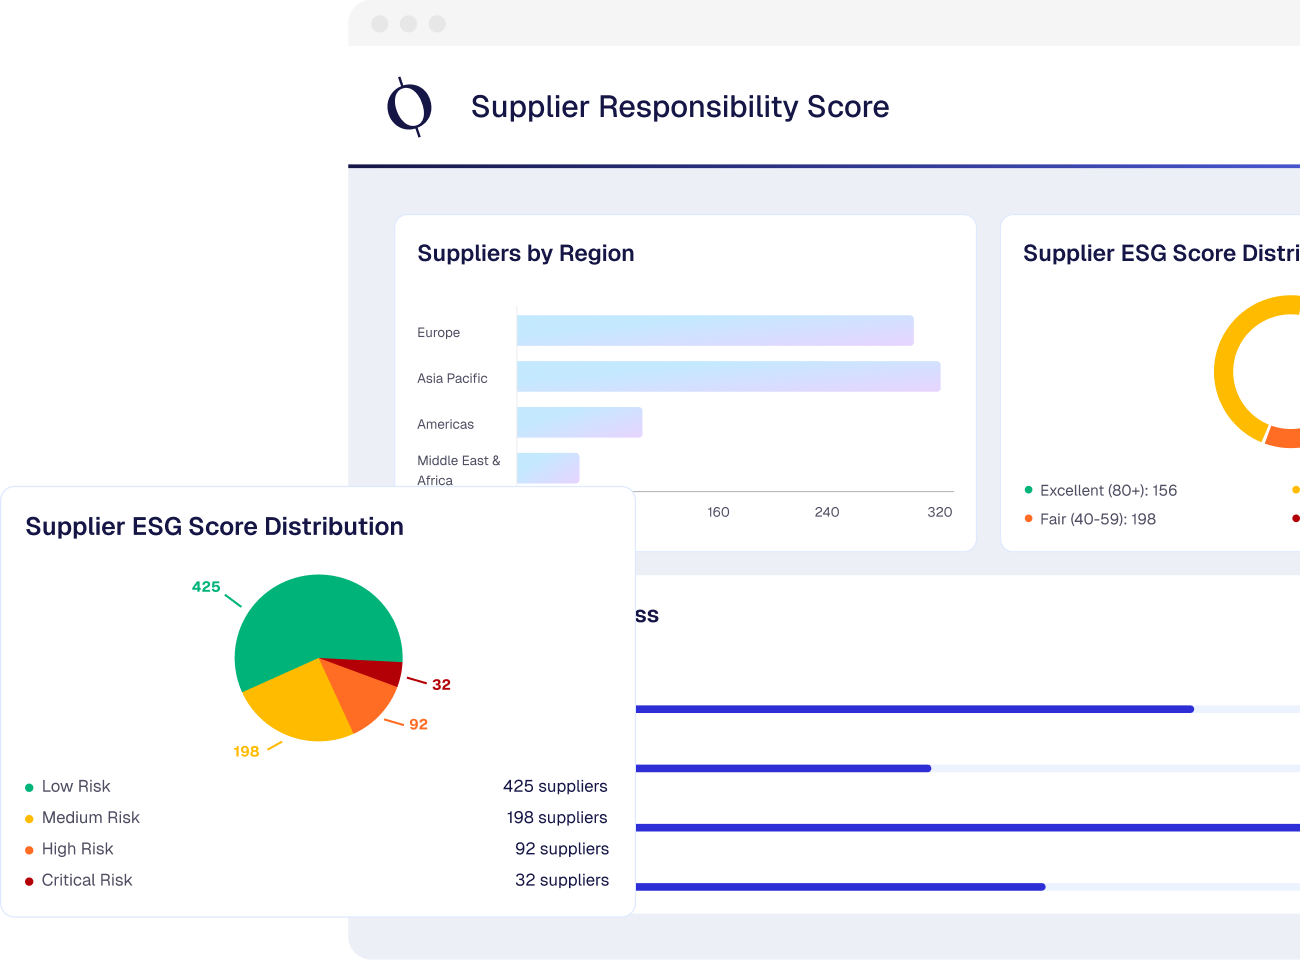
Supplier Responsibility Score
Supplier Responsibility Score is the core Cindeks™ score that reflects your suppliers’ ESG responsibility and level of carbon and data readiness.
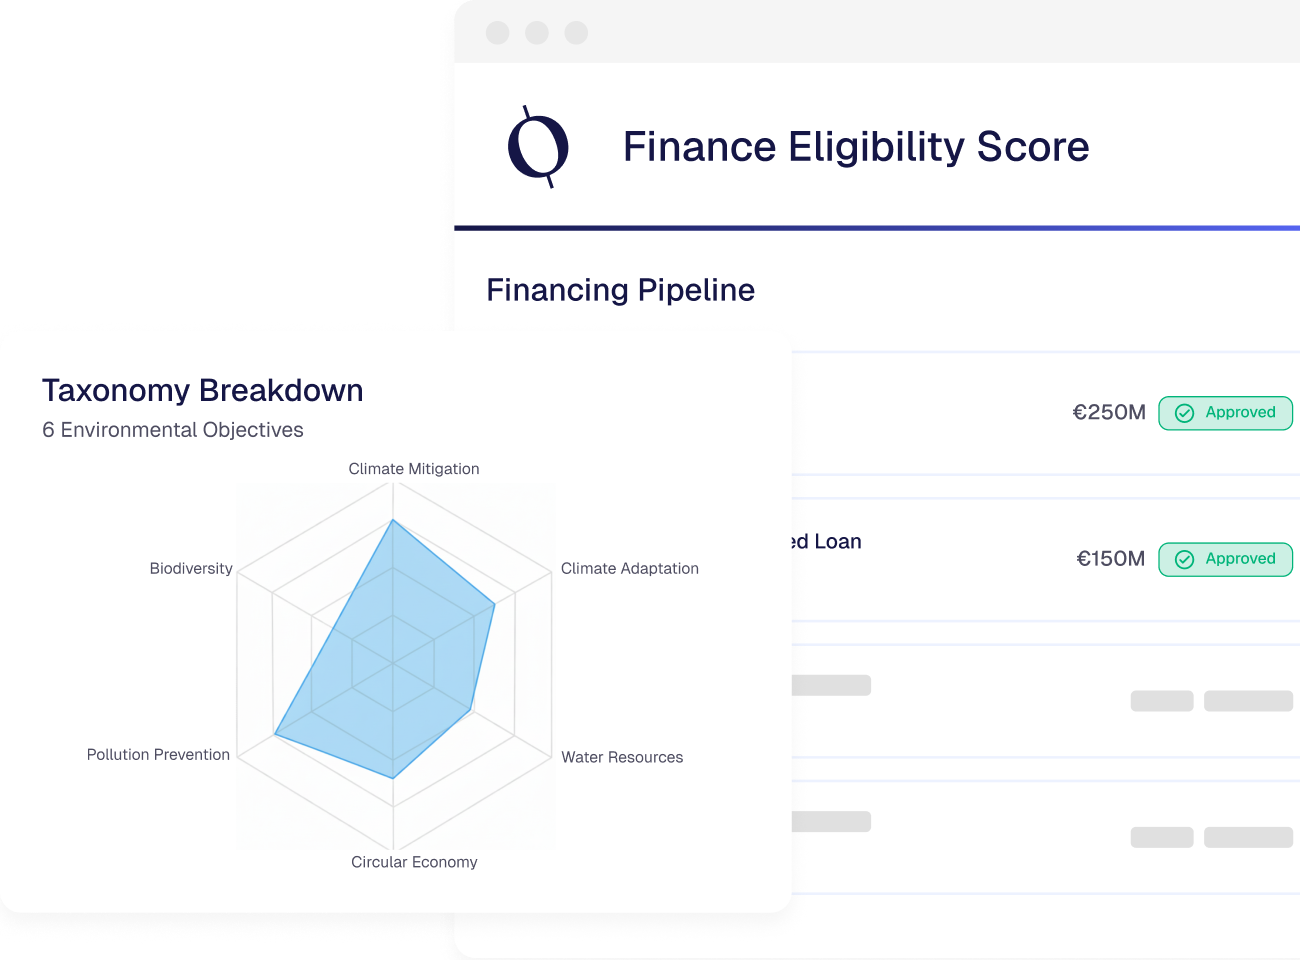
Finance Eligibility Score
Finance Eligibility Score is the core Cindeks™ score that reflects a company’s or project’s eligibility and readiness to access green financing.
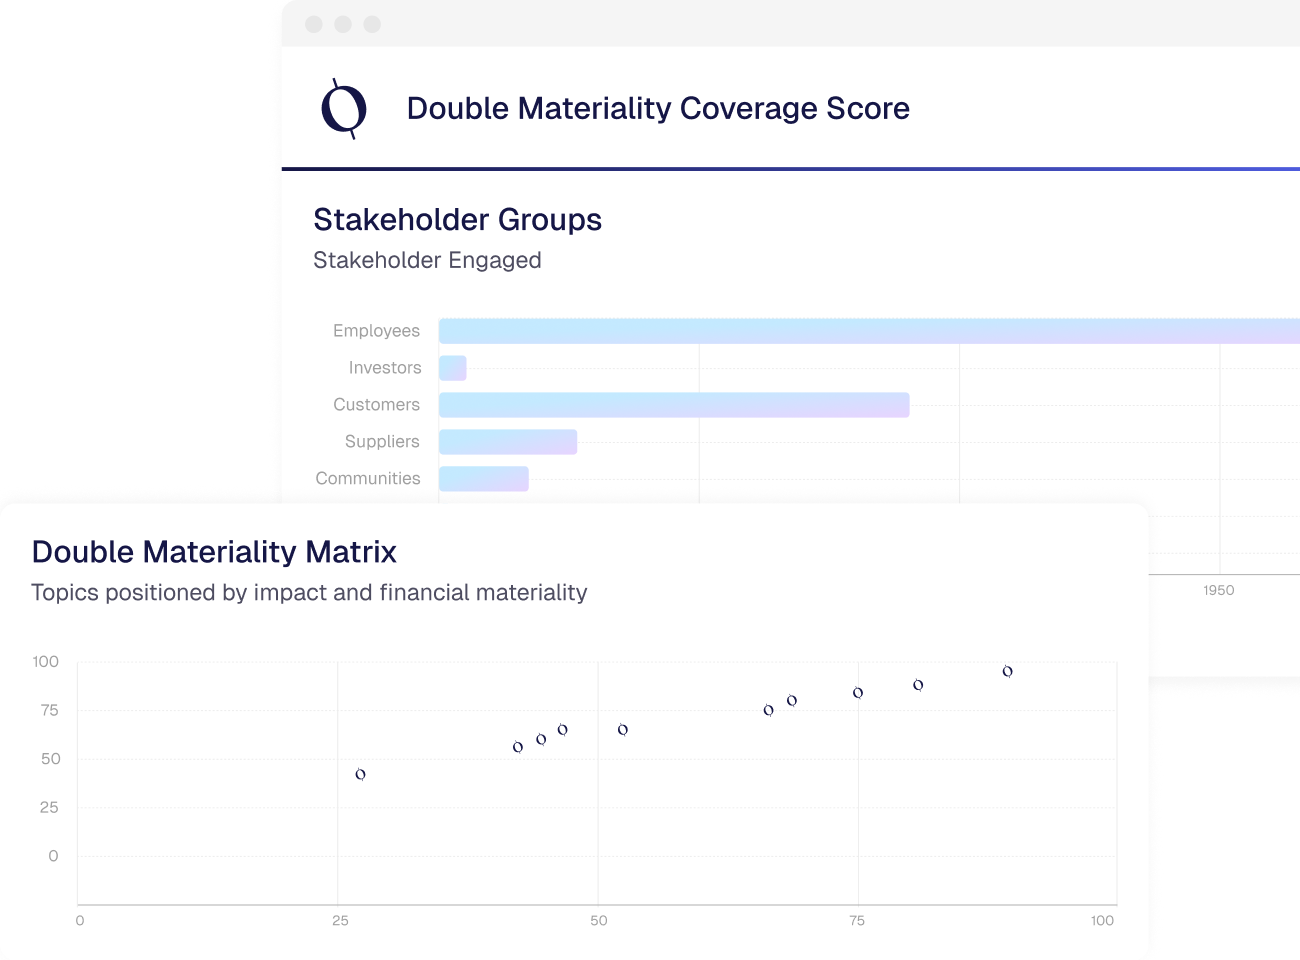
Double Materiality Coverage Score
Double Materiality Coverage Score is Cindeks™'s core score that shows how comprehensively your company conducts its double materiality analysis and how well it complies with ESRS requirements.
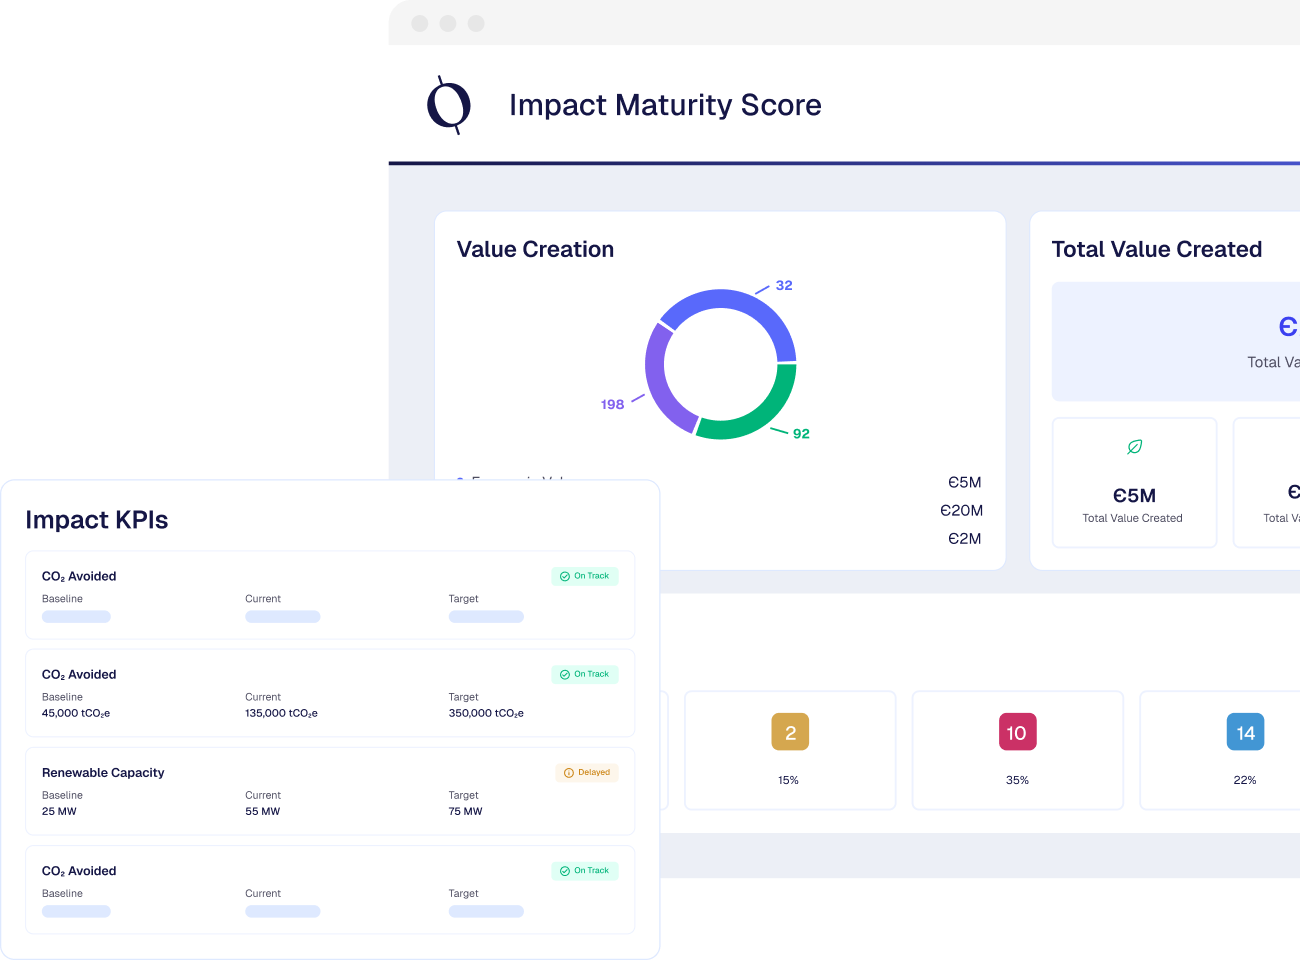
Impact Maturity Score
Impact Maturity Score is Cindeks™'s core score that shows how strongly and measurably a company or project demonstrates its actual sustainability impact.
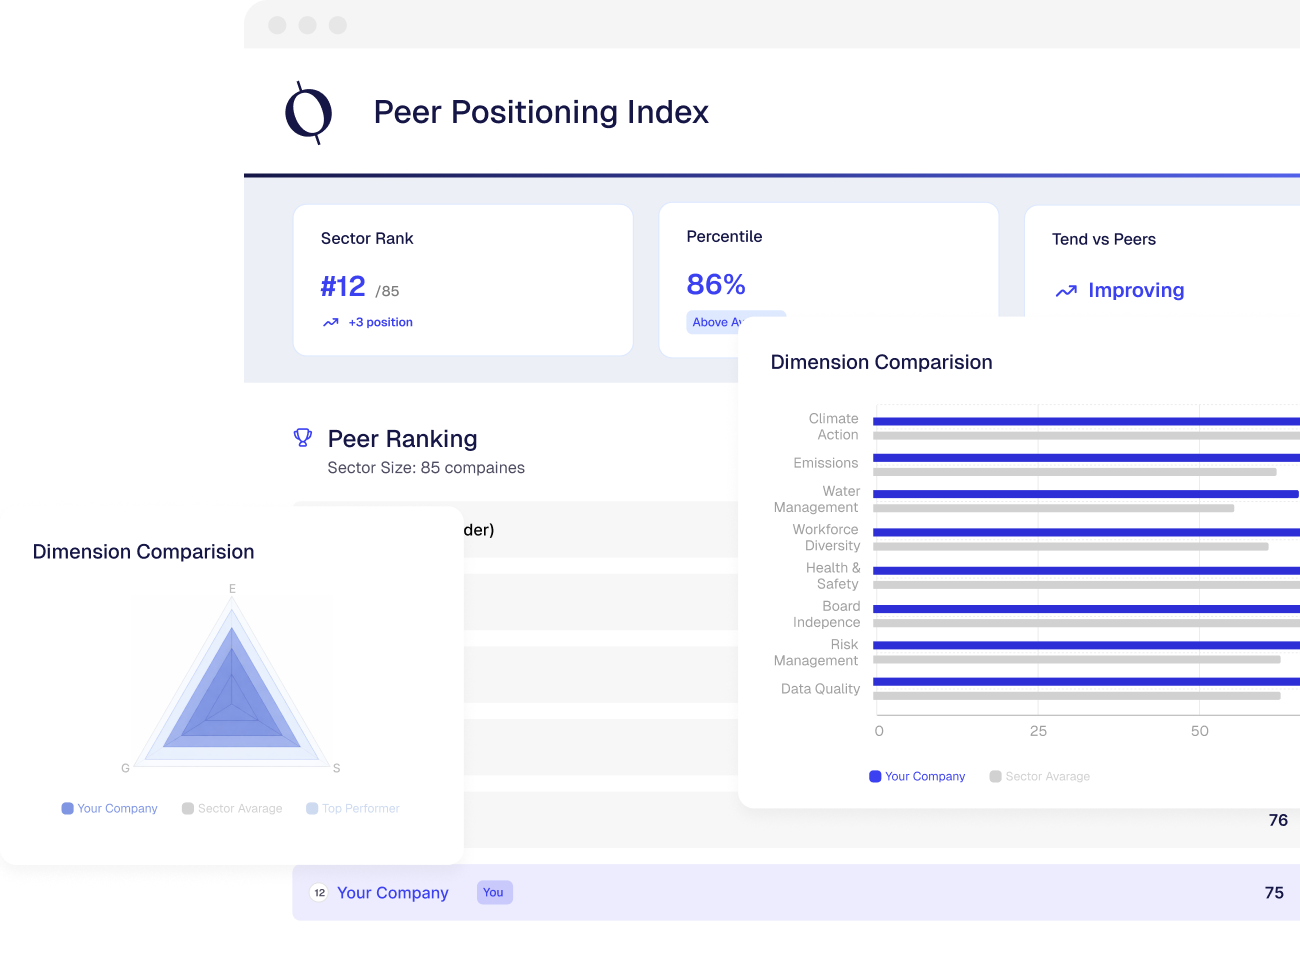
Peer Positioning Index
Peer Positioning Index is a Cindeks™ indicator that shows where your company stands by comparing your Cindeks™ scores with similar companies in your industry.
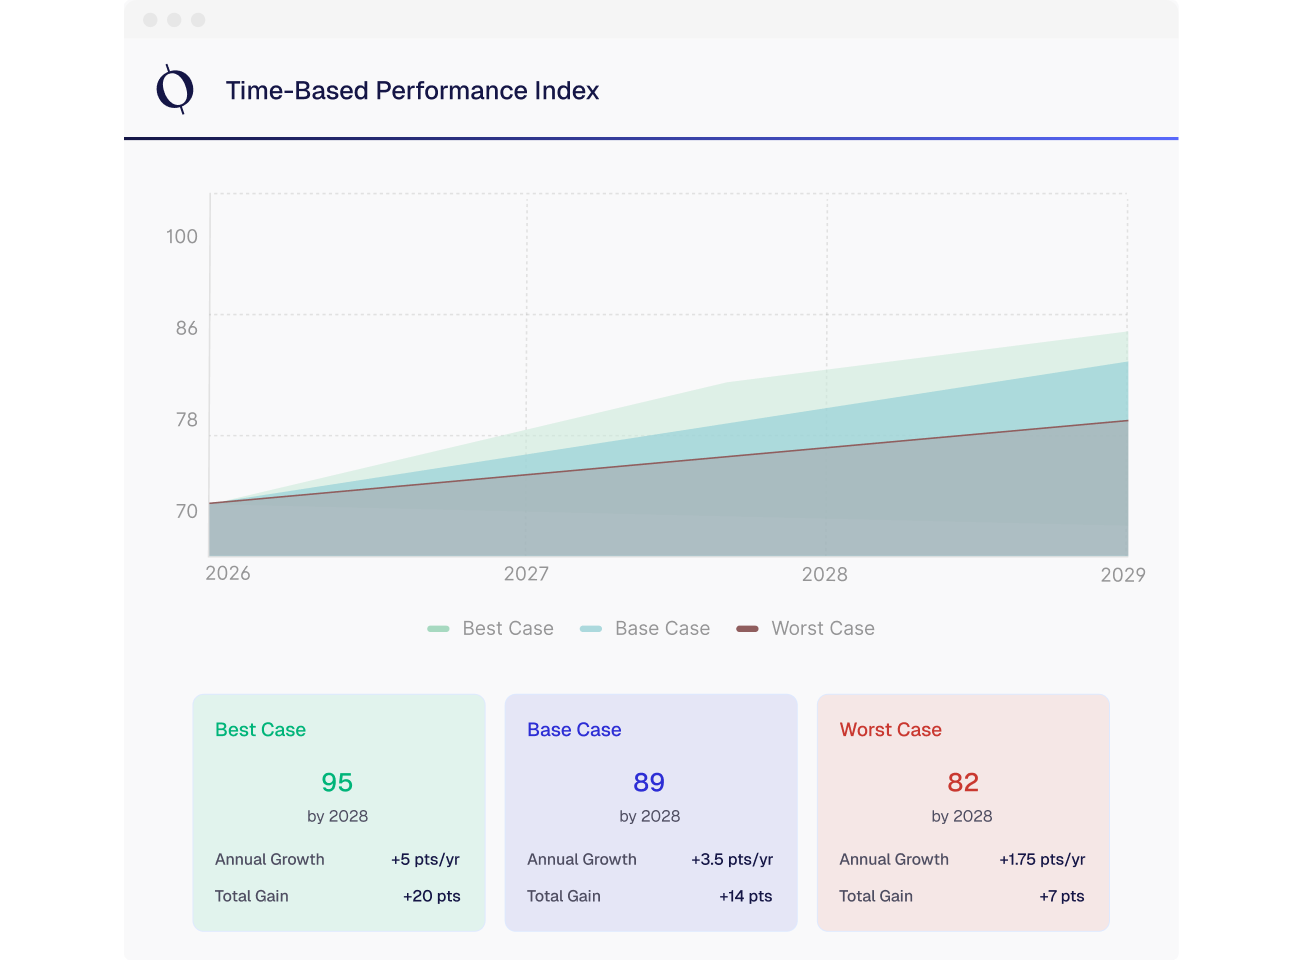
Time-Based Performance Index
Time-Based Performance Index is a trend indicator that shows how all your scores within Cindeks™ change over time.
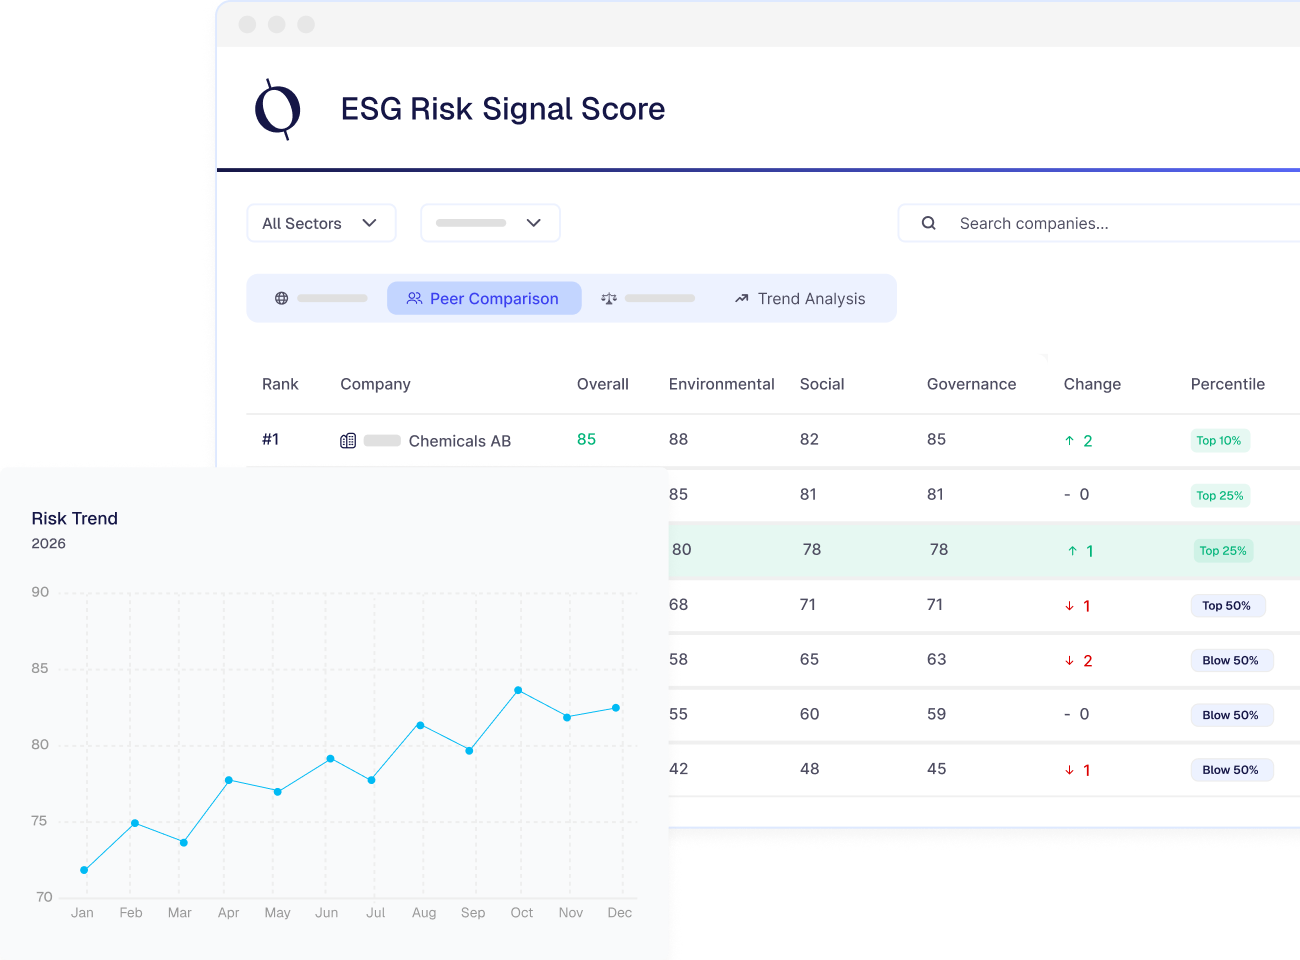
ESG Risk Signal Score
ESG Risk Signal Score is a Cindeks™ score that combines alerts from all products within Carbonance to summarize your company's ESG risk and non-compliance signals in a single indicator.